What to Visulize
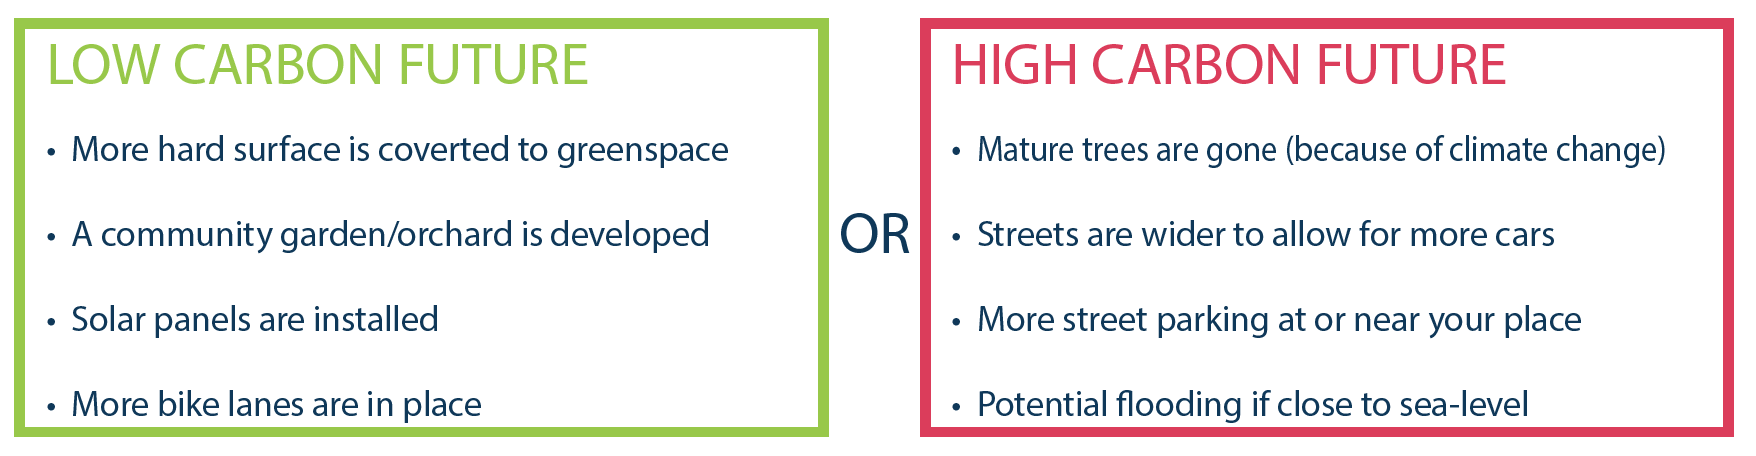
What other possible improvements do you want to see (e.g. shared compost bins, rain gardens, traffic calming curb gardens, passive solar houses)? Do some research to determine the feasibility of your ideas, and talk to people who have already made improvements - remember, this is great hands-on learning!
If you have done the vulnerability mapping or the scorecard, please look back to your vulnerability map and/or your score, think about things that you can do or changes that you want to see in your community to help tackle the risk features or improve your score, and visualize them! We have some suggestios to help you get started!
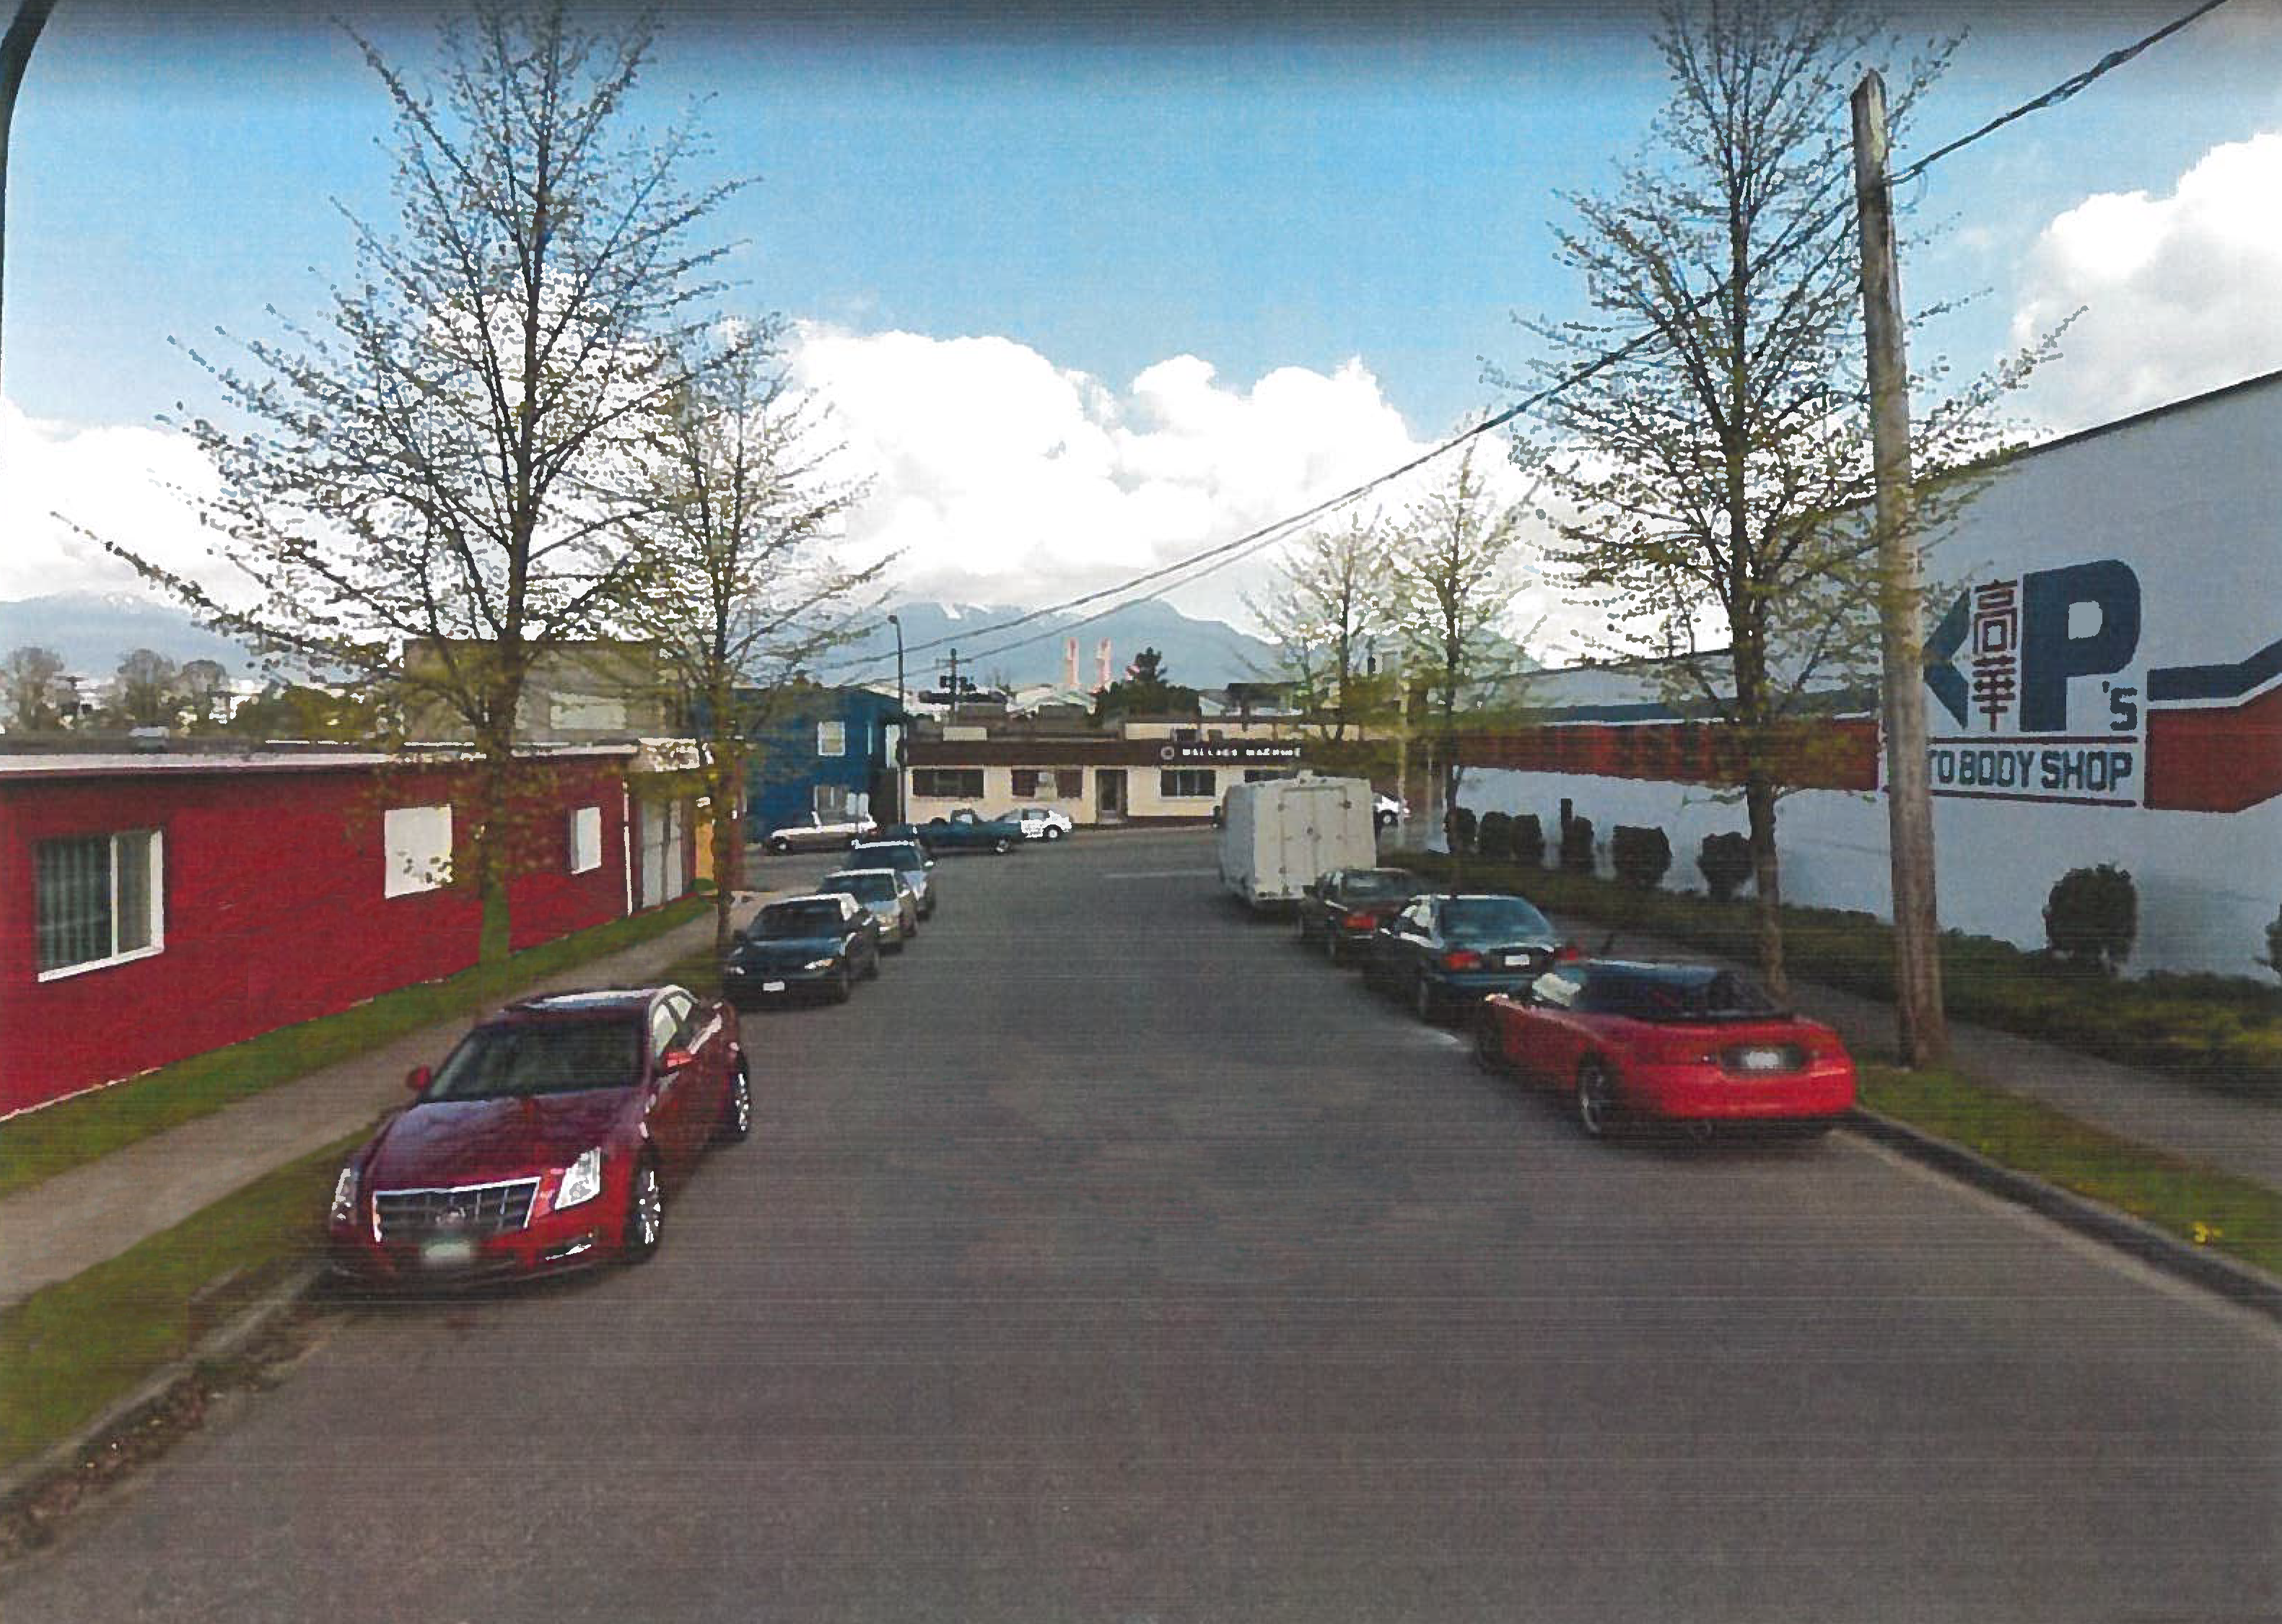
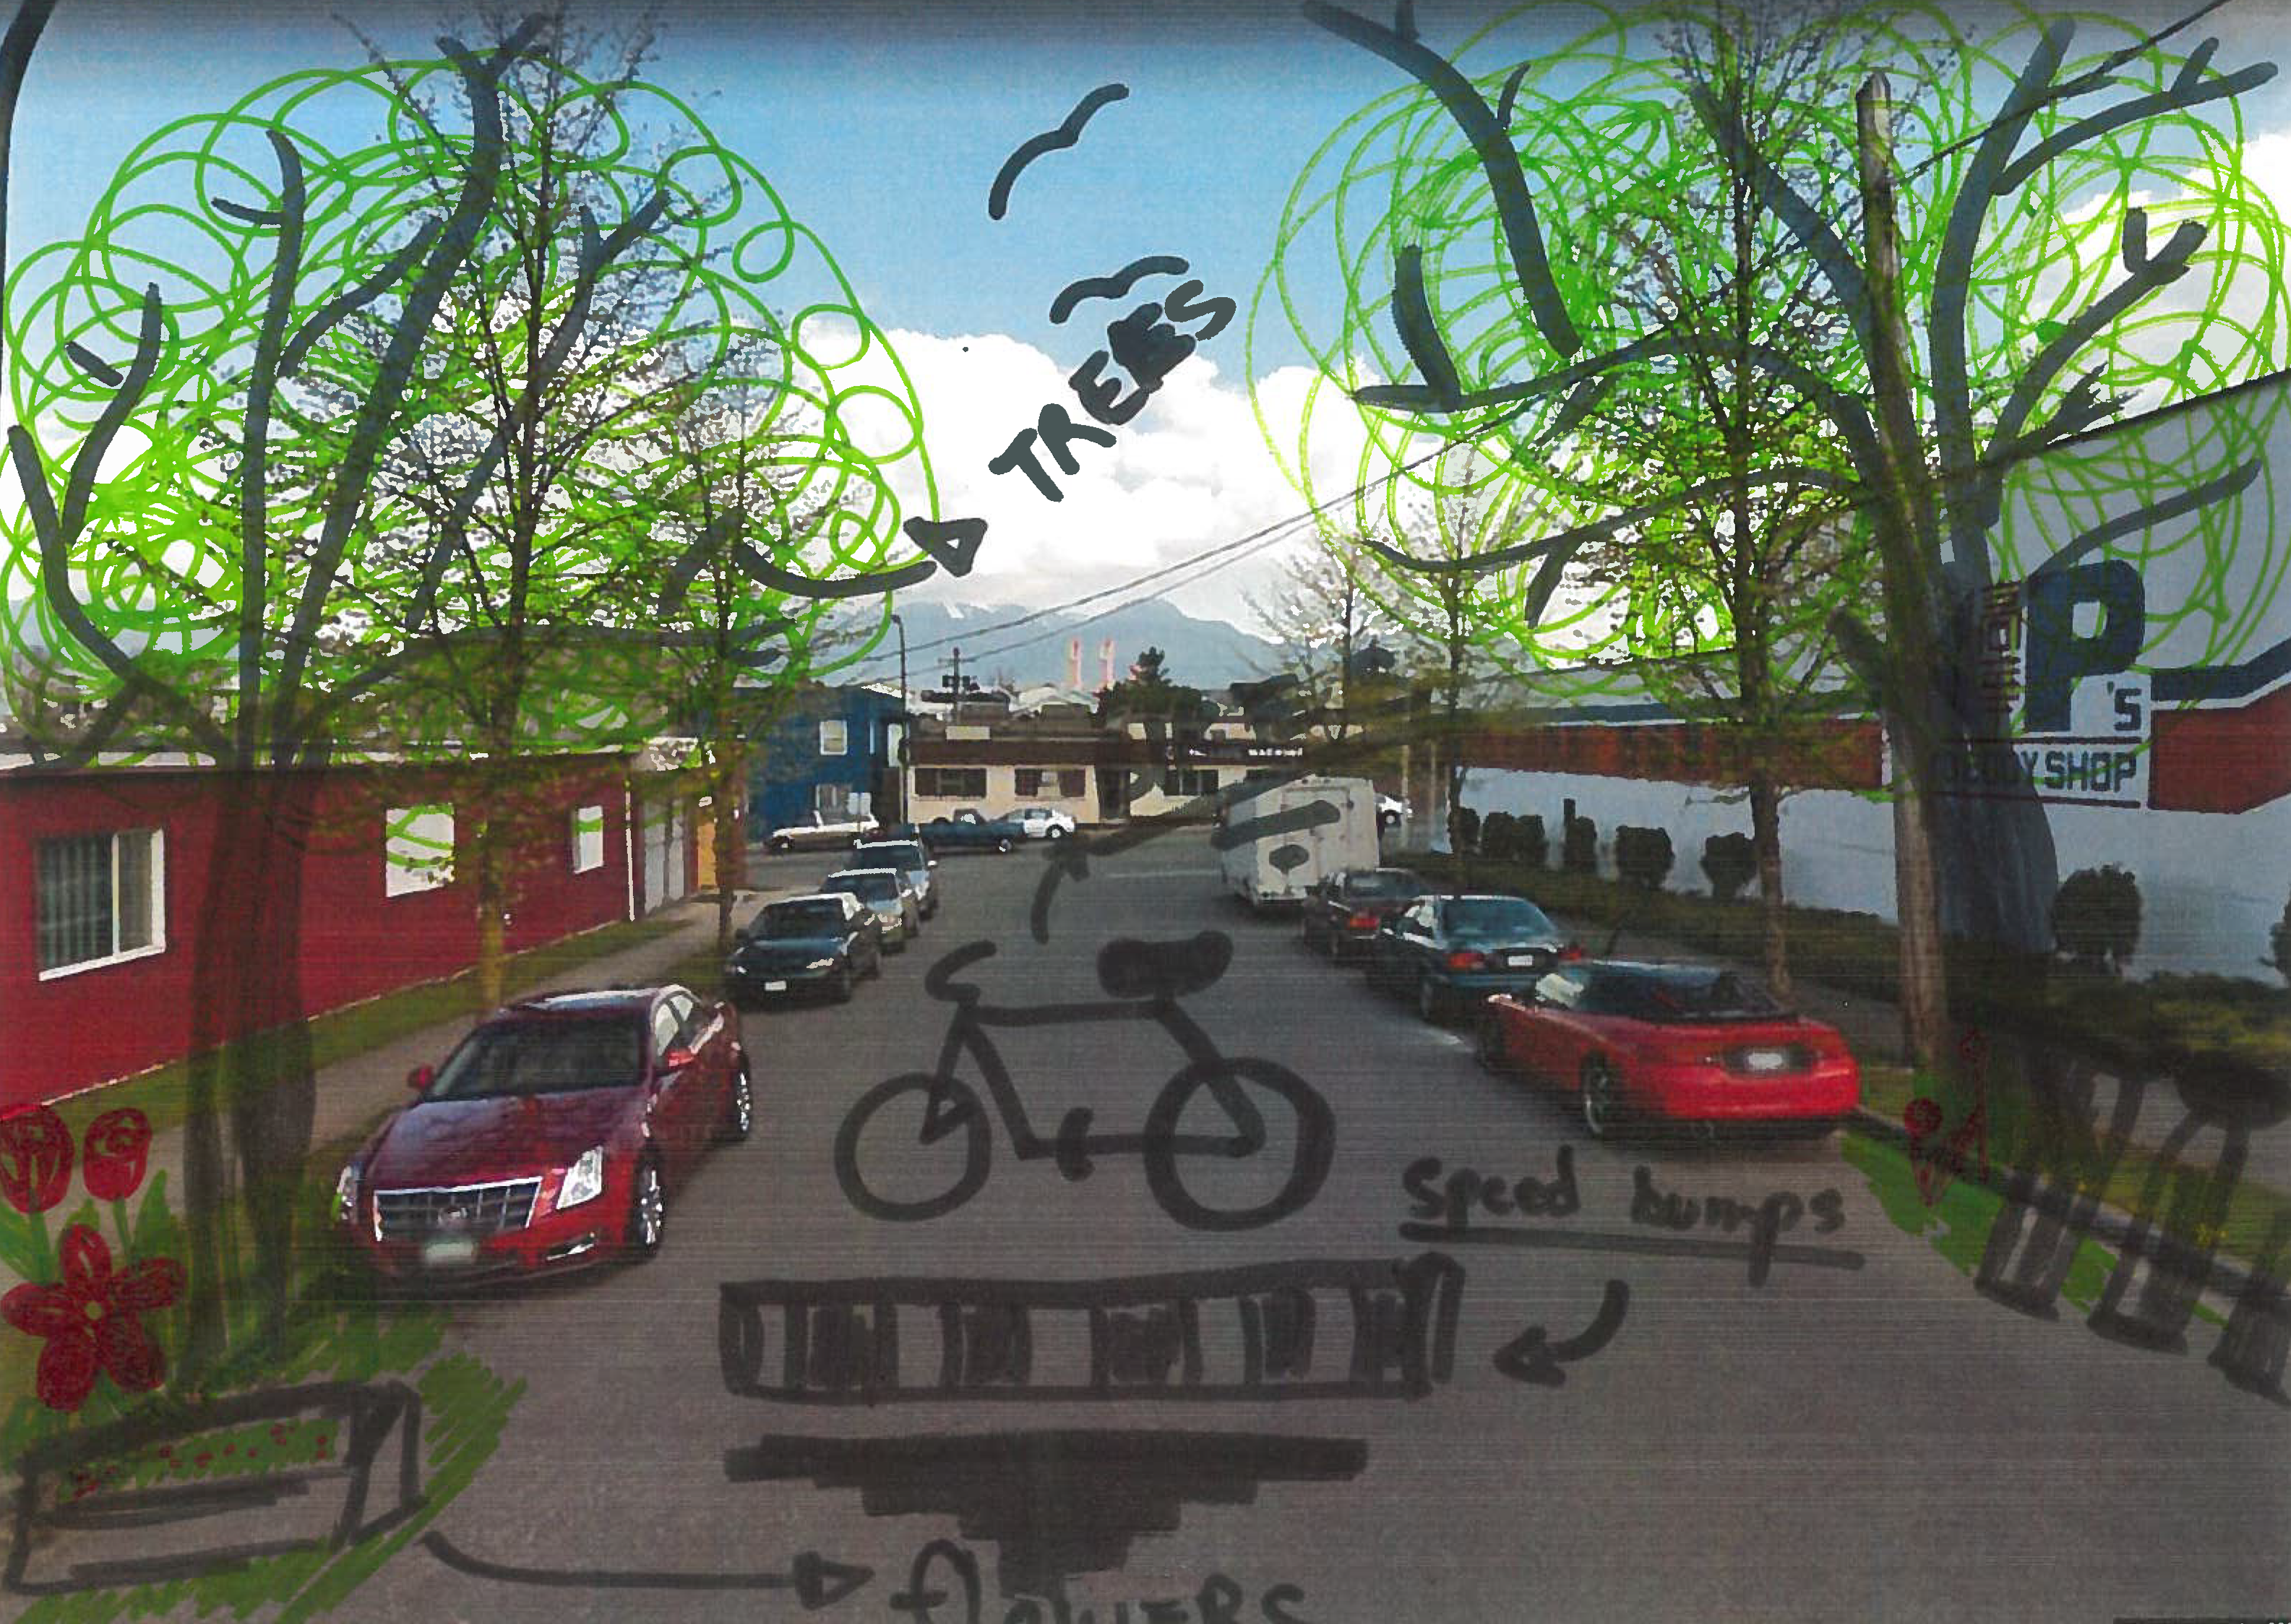
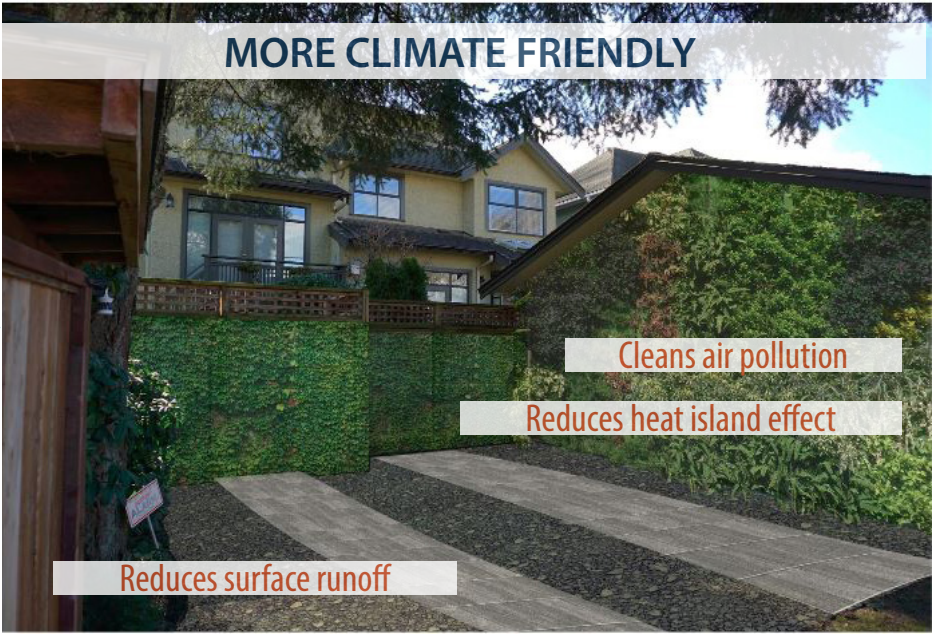
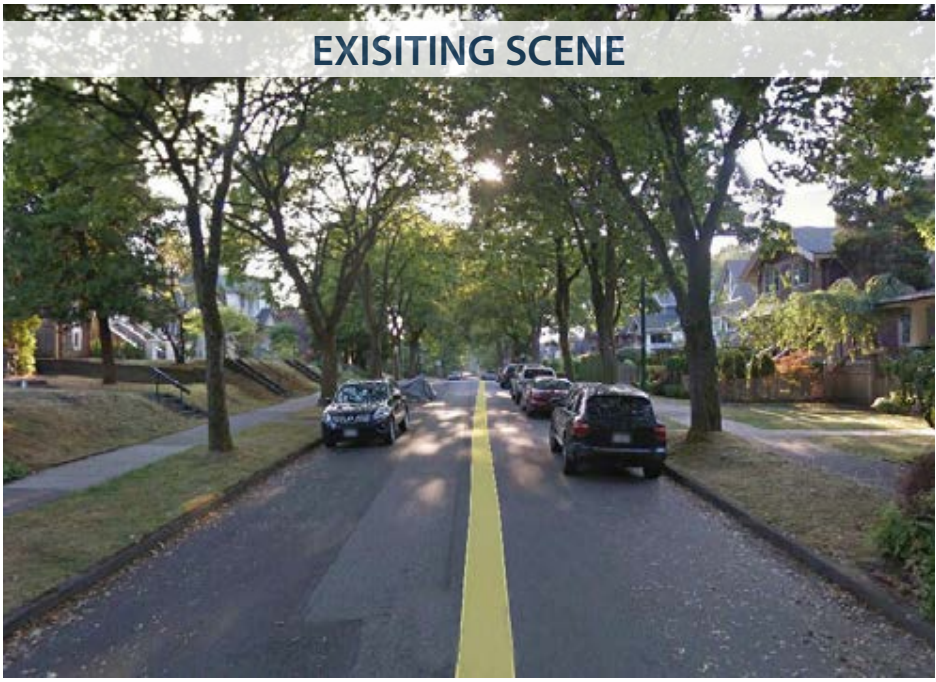
Visualization Examples
Example 1: click the arrows to see the visualization
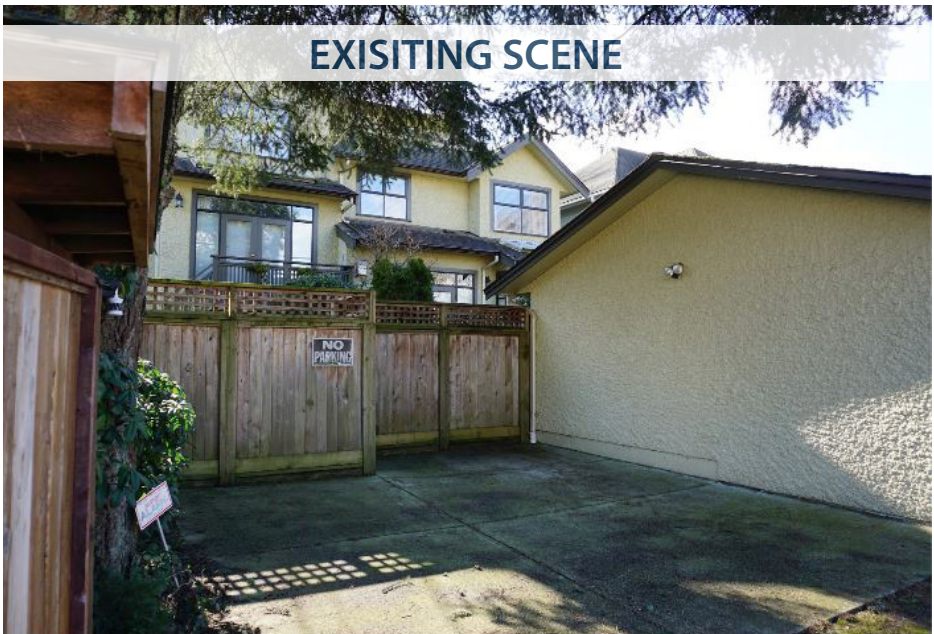
Example 2:
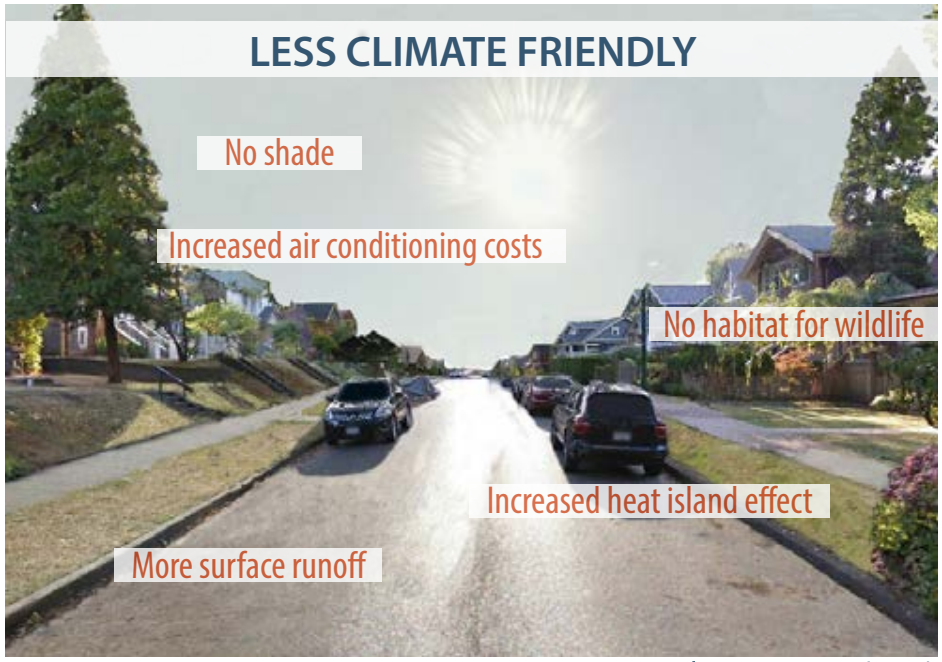
Example 3: