What is Vulnerability Mapping?
Vulnerability mapping shows the areas which may be susceptible to damage from environmental or manmade threats, such as climate change. This type of mapping can help you think differently about the kind of risks that could affect your block and help you label things you may want to change. This is a simple mapping exercise in which you will identify high and low risk areas of your block based on one or more climate change threats of your interest.
Procedure :
1. Print out an aerial photo of your block (8.5x11 landscape)
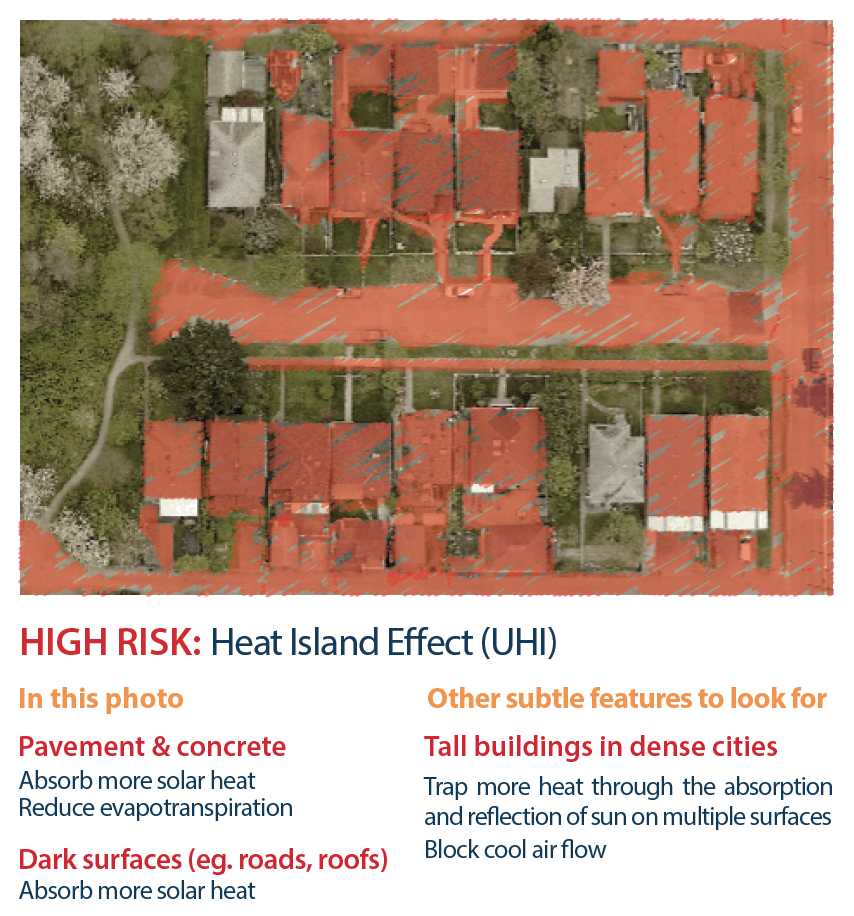
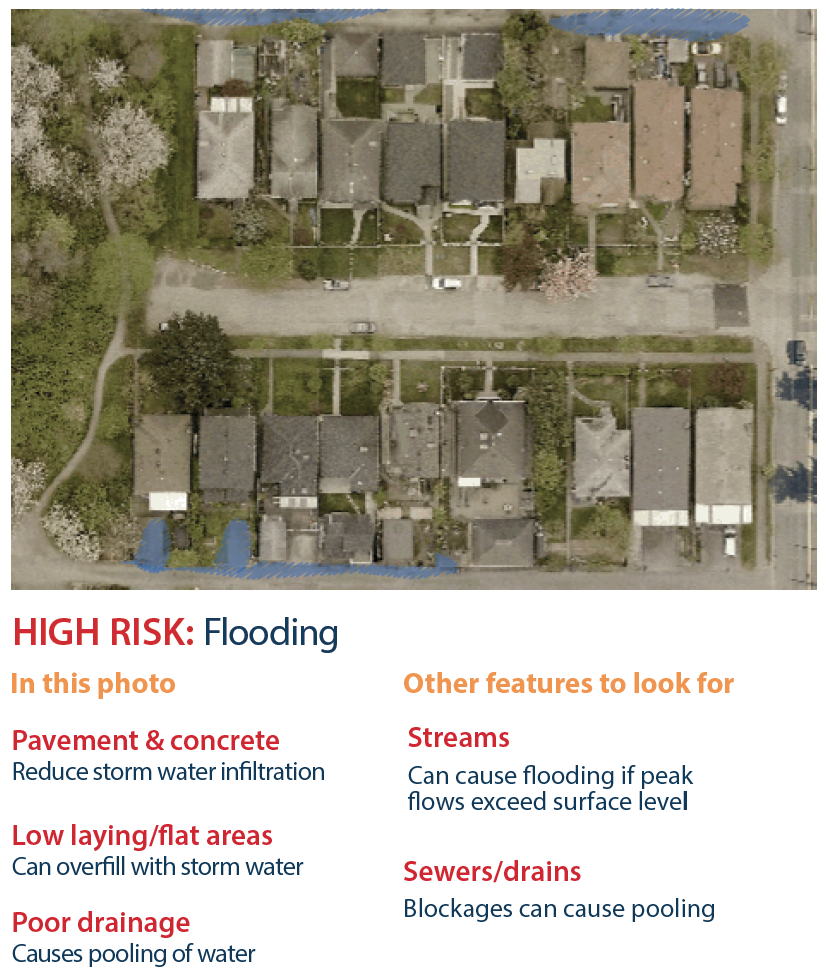
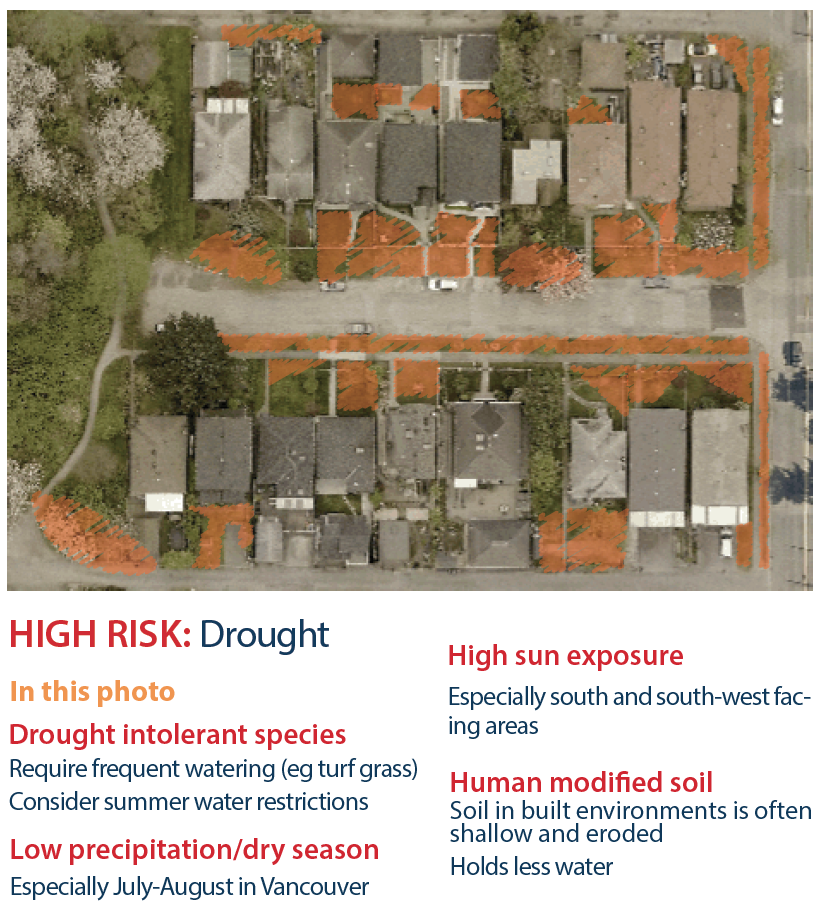
2. Choose one or more risk features from the diagrams below such as urban heat island effect (UHI), drought, or floods. Refer to
background for climate change risks likely to occur in Vancouver
3. Identify parts of your block that would be most susceptible to these threats
4. Identify parts of your block which would be least susceptible to these threats, such as dense canopy, white roofs, and pervious surfaces - refer to
habitat mapping for descriptions of these surfaces
5. Colour in or mark high and low risk features with your own colours or symbols
6. Think about your results, how vulnerable your block is, and what you could do to help improve conditions for the future

More examples of high and low risk features to map